Bollinger bands® in Forex
Change video quality to 1080p HD
In terms of its construction, Bollinger bands are made up of three lines – the middle line and the outside 2 bands. The middle line is a simple moving average with a default setting of 20 periods. The distance between itself and the outside bands is measures in standard deviations. The default setting for that distance is 2 standard deviations. If you are not sure what standard deviations are or how they are calculated, do not worry. Realistically, you do not need to know that. The only factor you need to know is that standard deviations are used as a measuring tool for the distance between the simple moving average and the outside bands.
Using Bollinger bands to trade into a trend
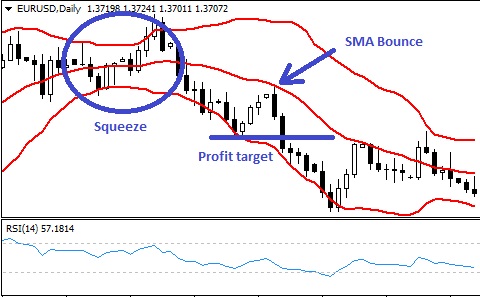
Bollinger bands measure volatility. Remember, when trading Forex we do not get access to volume so volatility is absolutely crucial to our trading. The higher the volatility the more players there are in the market. The lower the volatility the fewer players there are. The way in which Bollinger bands identify periods of low volatility is by creating a ‘squeeze’. When the outside bands contract and move towards each other, the squeeze is formed and the market volatility decreases. This means that the current trend is running out of steam. However, when a new trend begins (after the squeeze/period of low volatility) new opportunities arise to get into that new trend.
To do this we need to wait for a bounce from the simple moving average (middle line). Once this bounce occurs, it is time to trade the potential trend continuation. The profit target is the previous low (if you are selling) or the previous high (if you are buying).
Using Bollinger bands to trade reversals
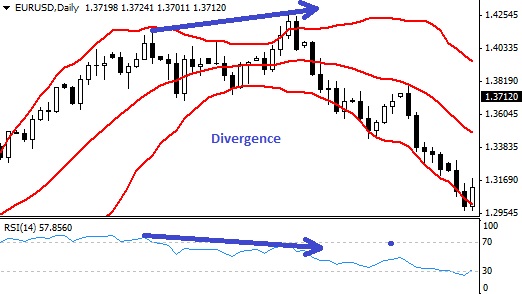
Forex traders never use Bollinger bands only to trade reversals. The bands are simply not strong enough. This is why we need to use another indicator along its side, such as the Relative Strength Index (RSI). The reason why we use the RSI is because we are looking for ‘diversion’ between the RSI and Bollinger bands. For example, in a scenario (as described in the video) where we are trading a top reversal (we are selling) we are looking for two hits on the top Bollinger band with the price levels either rising or being at the same level. At the same time, we are looking for the RSI to produce a completely opposite reading of weakness from the point where the first hit reaches the second hit on the Bollinger band indicator. Once this occurs, we are ready to trade a potential reversal.

After the initial squeeze, a new trend begins where prices typically bounce from the simple moving average (middle line)

Divergence between the top Bollinger band hits and the Relative Strength Index (RSI) reverse the trend.


