Commodity Channel Index (CCI) in Forex
Change video quality to 1080p HD
Commodity Channel Index is a versatile indicator which had originally been designed for the stock market, but in today’s markets the indicator is used in virtually every trading environment, including the Forex market.
Once we load the commodity channel index (CCI) to our charts we can see that there are two horizontal lines we need to focus on. The first is the +100 line and the second is the -100 line. When the CCI line crosses over the +100 line or below the -100 line, prices are said to be away from their normal trading range. Ultimately, this means that when CCI is above the 100 line prices are in a strong up-trend and when CCI is below 100 prices are in a strong down-trend.
Using commodity price index (CCI) to get into a current trend
The first thing we must do is establish that there is a trend in the market. Sometimes, simply looking at prices will allow us to do this but at other times, we do need additional indicators to confirm this. The best indicators to confirm trends (and their direction) in this scenario are moving averages and the momentum indicator.
Moving averages indicator
When trading the daily time frame we use the 10 and 20 moving averages to confirm trend direction. If lower time frames are used, the time periods for all indicators should decrease also. The confirmation comes when we see the moving averages cross over. If we are buying we need the 10MA to cross over the 20MA and if are selling, we need the 10MA to cross under the 20MA. Once we have the cross-over, the first trend confirmation is in place.
Momentum indicator
In simple terms, the momentum indicator has a key level of 100; where we draw a horizontal line. Once the reading is above 100 the trend is said to be rising and once it crosses below 100, the trend is said to be falling. So, if we are buying, we need to wait until the momentum indicator reading is over 100. Once this occurs, we have our second confirmation
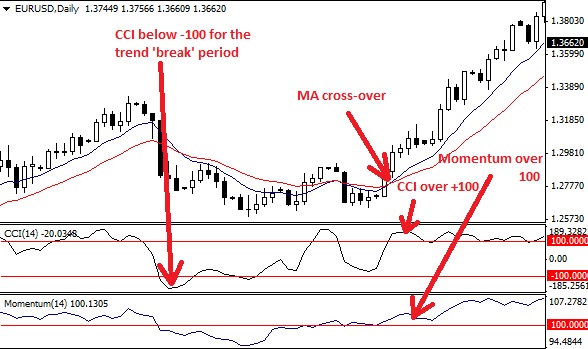
Now, we reference the CCI indicator. In a rising up-trend we need to see if the trend has had a break to regain its strength. It simply does not rise 100% of the time. Once this happens and prices slump slightly (which is usually before the MA crossover and a reading over 100 in the momentum indicator), the CCI indicator has to show a reading below 100; opposite to the up-trend we established earlier. The reason we look for this extreme reading on the lower side (below 100) is because we want CCI to show us that the trend ‘break’ has reached its lowest point.
After this point, we wait for a reading over 100 in the CCI indicator and ensure that the MA cross-over and the momentum reading over 100 are in synch with the CCI +100 reading. Once we get this ‘unison’ of indicator readings, it is time to enter the trade.

After the CCI below -100 for the consolidation period, we are waiting for a MA cross-over, momentum over 100 and a new CCI reading over +100 to get into a trend
Using CCI indicator to get into a new trend
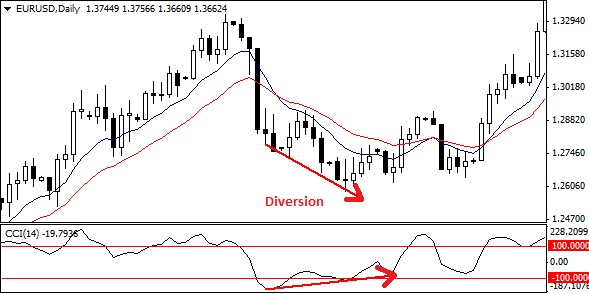
As we mentioned earlier, the CCI indicator is versatile so it can also be used to get into a new trend being created as a result of a reversal. To enter a trade in this manner we are looking for diversion in the CCI indicator compared to prices. That is, prices and the indicator readings are heading into opposite direction. So, if we are trading a bottom reversal and prices are making new lower lows, the CCI indicator needs to make new lower highs. This is the diversion we are looking for. We are then waiting for a cross over the -100 line in the upward direction to take our trade. Watch the video tutorial for full instructions.

To trade reversals we are waiting for diversion between prices and the CCI indicator


