Stochastics indicator trading in Forex
Change video quality to 1080p HD
Trend traders always like to know when a trend is beginning to weaken. This may be to take profits from the current trend trade or to get ready to get into a new trend. This is exactly where the stochastics indicator comes in. It literally recognizes overbought and oversold areas of a trend.
it is made up of two lines - %K and %D lines. What this means is not relevant. What is important is that you understand that the standard setting for the indicator is 14,3,3. ‘14’ relates to a number of last trading session the indicator is taking into account i.e. last 14 trading sessions, and the 3’s are the settings for the %K and %D line.
On the right hand side of the indicator window we have a vertical scale that ranges from 0 to 100. However, there are also two very important levels that are emphasised in the scale. Those are 20 and 80. The reason why is because a stochastics reading under 20 signifies the market is oversold and when it is above 80 it is overbought. This is where our first clues become apparent that the current trend is weakening. The problem is that the indicator produces a lot of ‘fake’ readings so we need to combine it with another indicator.
To increase its reliability we need to combine it with a 200 exponential moving average (EMA). This will confirm trend direction. That is, when prices are below the 200EMA and the EMA is sloping down, we focus on down-trends. When prices are above 200EMA and the EMA is pointing upwards, we focus on up-trends. The point is that we do not trade against trend direction; we only trade in the direction of the trend that is confirmed by the 200EMA.
Trading pull-backs with stochastics
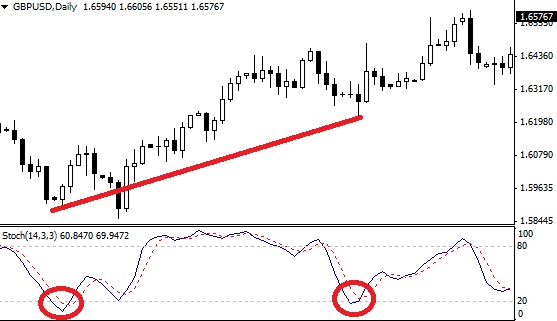
All trends need a break to re-gather their strength and continue to travel in their original direction. This ‘break’ could either result in a few flat trading sessions or a low-term reversal into the opposite direction. This low-term reversal is called a pull-back. It is these pull-backs that provide entry opportunities for traders. Once the pull-backs are in an oversold/overbought position it is very likely that the trend will re-continue in the original direction. For example, in an up-trend a pull-back needs to have a stochastics reading below 20 to give us a clue. Once stochastics crosses back over the 20 level, we have a much stronger confirmation.
The only thing to do then is to ensure that the low of the pull-back is higher than the previous low that was in an oversold stochastics level. If this is the case then we take the trade. The stop loss is placed a few pips below the ‘entry low’ or the previous low (if you wish to give your trade more room to move around). The same applies for down-trends but in reverse so watch the video tutorial to view our example.

Pull-back is higher than previous low that was in an oversold stochastics position
Trading divergence in stochastics
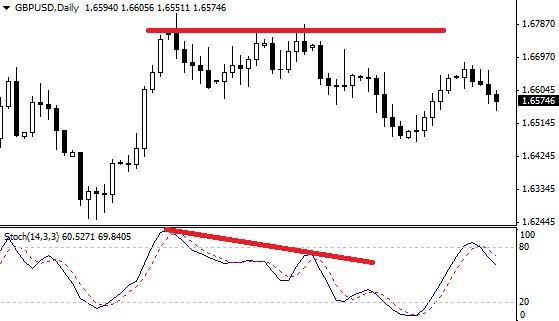
Divergence is simply when the technical indicator and prices are trading in opposite directions. So, when prices are rising the indicator is falling. This is the essence of this trading method. If we have equal highs in price (or rising highs) but stochastics is creating lower highs, this indicates that the upward marathon is running out of steam. It is then that we utilise this signal and take a reversal trade in the downwards direction. Our target is the previous low.

Stochastics divergence shows a weakening in the rise of prices
Trading trend line breaks with stochastics
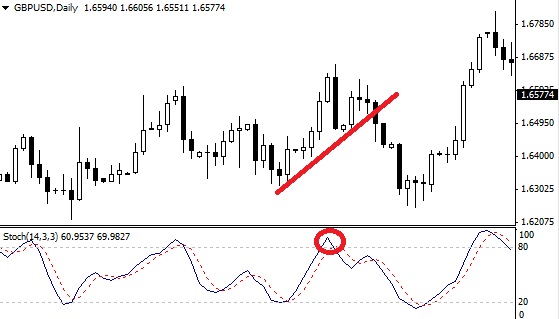
This is probably the simplest way of trading this indicator. In an up-trend we can join the lows to form a trend line. Once this trend line is broken we are looking to trade down. However, we need more confirmation than a simple trend line break.
At the time of the trend line break we need the indicator to show us that the last high has come from an overbought position. If it has then this provides a good signal to place a sell.

The high before the trend line break came from an overbought stochactics position.


