Relative Vigor Index (RVI) trading in Forex
Change video quality to 1080p HD
Relative vigor index or RVI is a great technical indicator to use and trade pull-backs or trends. When used in conjunction with other technical indicators the period setting us usually 14. This is because it is always better when all technical indicators used have the same period setting. However, when the RVI is used on its own, lowering the setting down to 10 periods is required.
The relative vigor index has two lines – a green and a red line. It does not matter what these lines are or how they are calculated. The only two factors that we are concerned with here are:
- Where do the lines cross over and cross under
- What does this mean in relation to our price chart
In general terms, when the green line crosses under the red line, we have a down-trend. When it crosses over the red line, we have an up-trend. However, do not make the mistake of placing a sell every time the green line crosses under the red line and certainly do not place a buy when it crosses over the red line. This is because we need a lot more confirmation to ensure the relative vigor index is reliable in our trading scenario.
Another factor to remember is that when we use the RVI, we do not reference the scale on the right hand side. The values are not important to us. We are simply focusing on the areas where the RVI lines cross each other.
Combining relative vigor index (RVI) with 100 exponential moving average
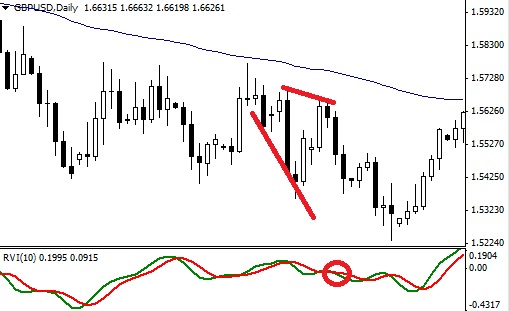
By using the 100 EMA, we are confirming trend direction. So, when prices are below the EMA we trade downwards and when they are above EMA we trade upwards. However, this is not enough. We also need prices to show us that they are continuing to go in a specific direction. When prices are falling, we need to see them making lower highs and lower lows. Coupled with trading under the 100EMA and an RVI cross under; we have a very good selling signal. The same applies to up-trends but in reverse. Now we are looking for prices to trade above the 100EMA, prices to show higher lows and higher highs and we also need to see an RVI cross-over. This is a very good buy signal.

Trading under 100EMA, prices making lower highs and lower lows and the green line crossing under the red line produces a good selling signal
Using the RVI ‘0’ line
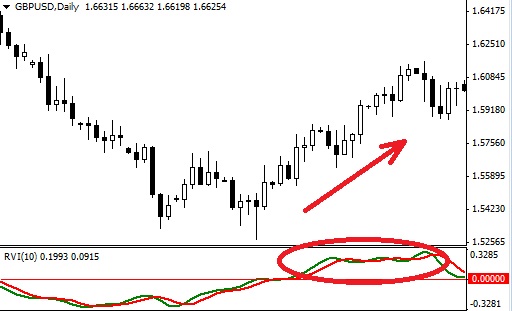
The ‘0’ line is simply the mid-point of the indicator window. In this method all we need to see is the relative vigor index trade on the right side of the ‘0’ line relative to trend direction. So, when trading upwards we need the RVI lines to be above the ‘0’ line and when we are trading downwards we need the RVI line to be below the ‘0’ line. The same rules of lower highs and lower lows/higher lows and higher highs apply but, this time we need to wait for the RVI to be on the right side of the ‘0’ line.

When RVI lines are above the '0' line prices tend to rise
You may find that using one of these methods may get you into trends a bit late so combining both methods will ensure you do not miss out on any trading opportunities. With that said however, combining one of these methods with an indicator you are comfortable with should also provide good entry signals.


