Relative Strength Index (RSI) trading in Forex
Change video settings to 1080p HD
The relative strength index (RSI) is a technical indicator that tells us if a trend is overbought or oversold. It does this by comparing the gains and losses in price and plotting them in a line format in its indicator window. It is because of this that relative strength index is a great technical indicator to use for getting into a trend but it is also a great tool to spot trend weakness which allows us to take profits at the right time.
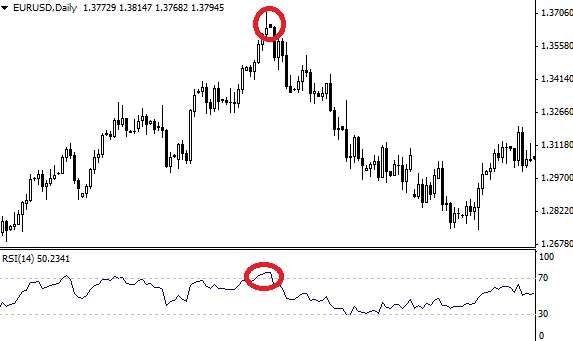
On the right hand side of the indicator window you will see a scale that ranges from 0 to 100. On that scale two very important levels are shown; 70 and 30. The reason why these levels are emphasised is because they are the overbought and oversold levels. So, if we are in an up-trend and the RSI reading is 70; the up-trend is overbought. If we are in a down-trend and the RSI reading is at 30; the down-trend is oversold.
Period setting
The standard period setting for RSI is 14; which can be used for higher time-frames such as H4 and above. If you are trading time-frames that are H1 or below, the period setting should be adjusted accordingly.
Using RSI overbought and oversold levels
As we mentioned earlier, the 70 and 30 readings indicate that prices/trends are overbought and oversold. However, do not make the mistake of placing a sell every time RSI reaches 70 or placing a buy when it reaches 30. If these extreme levels are to be used we have to wait for RSI to cross back under 70 or cross back over 30. The reason why is because this is the point at which prices are likely to reverse. When they reach those levels prices are simply giving us a clue but when they cross back under/over we have good reversal signals.

Once RSI crosses back under the 70 line we should think about a selling position
RSI divergence
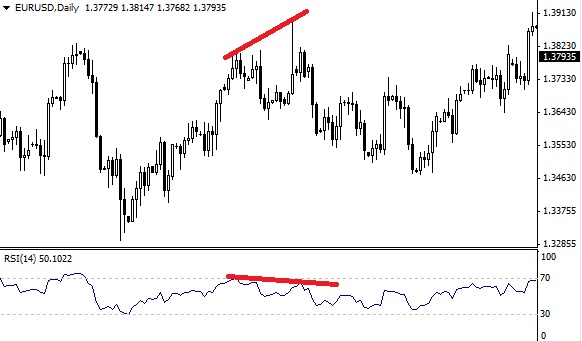
Divergence is defined as a trading scenario when prices and the technical indicator are trading in opposite directions. In the RSI video tutorial we have a scenario where prices are making higher highs but the RSI indicator is making lower highs. This means that they are travelling into opposite directions but more importantly, it means the up-trend is weakening. This is when traders need to take profits from the up-trend but also think about a selling position.

RSI divergence is a very good exit signal but it can also signify a beginning of a new trend
RSI 50% line
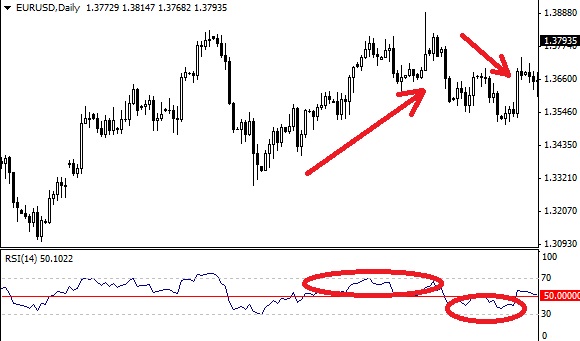
By simply drawing a horizontal line at the 50% point of the indicator window, we are able to see how powerful RSI can be. In general terms, when the reading is above the 50% prices are increasing so we should think about a buying position. When the reading is below 50% prices are falling so we should look for a selling position. To confirm direction, we should always use another indicator such as the momentum indicator or ensure that our Forex trading strategies are based on momentum.

When RSI is above 50% we usually see an up-trend but when it is under the 50%, a down-trend is more likely.


