Momentum indicator trading in Forex
Change video quality to 1080p HD
This is among the strongest and most reliable technical indicators available. The reason why is because the momentum indicator measures the strength and weakness of a trend. It is because of this that the momentum indicator provides great entry and exit signals for a current trend taking place. So, if you are a trend trader, this technical indicator is an absolute ‘must’.
The way in which it provides such good signals is by measuring the rate of change in closing prices. Then, it uses that data and displays it in a line format that is viewable in the indicator window.
It is very important that you understand that this is a ‘leading’ indicator. This means that it works slightly ahead of price. It is because of this ‘leading’ element that we are able to recognise trend strength and weakness. In other words, we are able to receive a positive reading before the trend actually begins and this is why the momentum indicator is a great ‘predictor’ of trend creation. All this is discussed below and explained in the video tutorial.
You must also understand that the lower the time frame, the choppier this indicator is. So, if you are a low time frame trader you may find it more difficult to use. If you trade higher time frames then you should not have a problem. That does not mean you cannot trade it in lower time frames; you simply need to be more alert.
Positive and negative readings
The first thing you must do is draw a line at the centre point of the indicator window. The centre line value is 100, although some Forex brokers use the value of 0. Do not worry if the value is different; the actual placement of the line is exactly the same; so to avoid confusion we are going to refer to the line as the centre point rather than a value.
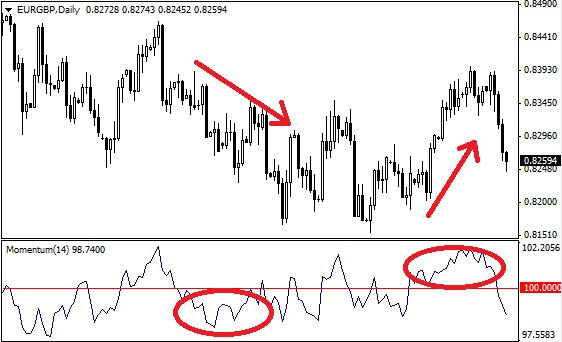
When the momentum indicator reading is above the centre line, prices are usually trending upwards. When the reading is below it, prices are usually falling. When this occurs, we have a good entry signal into the relevant trend direction. The only thing you must not do is trade in opposite direction. For example, do not place a ‘buy’ if the momentum reading is below the line and vice versa. Only trade when the trend is going in the correct direction relative to the placement of the indicator line i.e. trend up equals a momentum reading above the centre line and vice versa.

Our chart shows a down-trend when indicator is below the centre line and an up-trend when the indicator is above the centre line
Trading momentum divergence
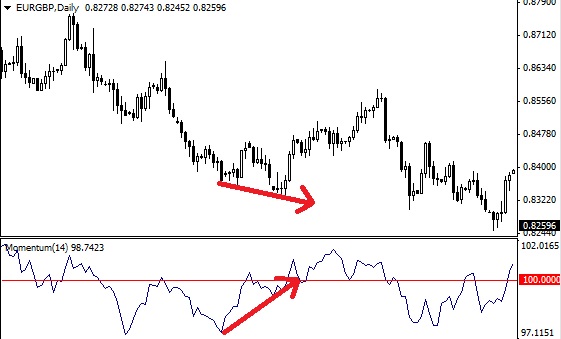
Divergence occurs when prices make lows or highs opposite to the indicator lows and highs. For example, if prices are making lower lows we know that we have a down-trend. However, we do not know the strength of this trend without referencing some kind of an indicator. This is when the momentum indicator steps in.
If the indicator is making higher lows at exactly the same time, we have divergence. This is basically when prices and indicators are heading into completely opposite directions to each other. The up-rise of the indicator suggests that current down-trend in the price chart is running out of steam. This is when we incorporate a reversal pattern such as the double bottom into the mix and take a trade at the relevant price level. Watch the video to see how we do this.

The appearance of higher lows in the indicator at the same time we see lower lows in prices signifies that the down-trend is weakening
Momentum breakout trading
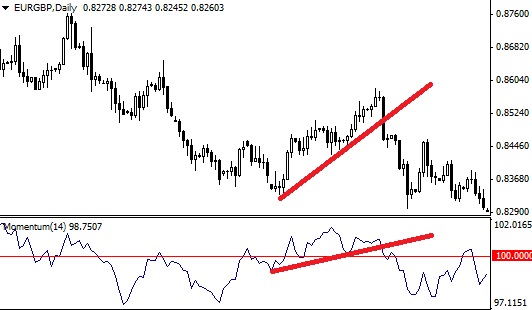
Breakout trading is one of the most common ways of trading. We simply draw a trend line that connects the lows in an up-trend or highs in a down-trend. Once this trend line is broken, we place a trade. However, this does not mean that we only trade breakouts in price charts. We also trade breakouts in the momentum indicator window.
By simply mirroring the same trend line we drew in our price chart within our momentum indicator (by connecting the lows or highs dependant on trend direction), we get a good signal for entry. So, if the price breakout occurs at the same time as the momentum breakout, we can trade.

A breakout in both the price chart and the indicator window at the same time


