Trading Average true range (ATR) in Forex
Change video quality to 1080p HD
Volatility is the measurement tool of a currency pair’s movement. It tells how large or small its trading range is at a given point in time. For example, currency pair A may move 100 pips per day while currency pair B may move 200 pips per day. In this example currency B is more volatile. It is this that the Average true range measures. Its sole purpose is to measure volatility for a given currency pair at a give point in time.
Average true range (ATR) can be used in two ways:
- It can be used to get into new trends
- It can be used to place a stop loss at a price level that is relative to the specific currency pair’s volatility (this will be explained in a simpler manner below).
Using Average true range (ATR) to get into trends
ATR measurements are plotted on a line within its indicator window. The higher the line the more volatile the trading sessions are and the lower the line the less volatile candles are. It does not identify trend direction; it only measures strength so do not get confused here. Just because the ATR line is going up does not mean it is measuring volatility for an up-trend. We repeat – it only measures volatility strength, not direction.
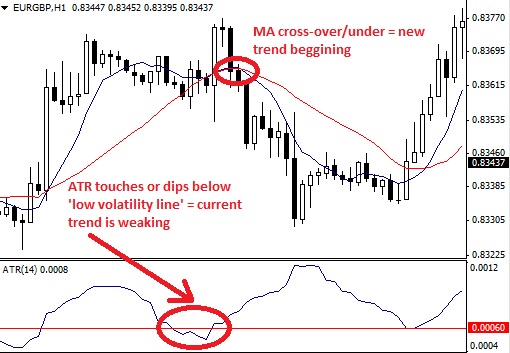
The question now is – ‘which level signifies low volatility’? Some traders tend to use 0.0001 but when trading H1 (for example) that is far too low. The almost perfect level is 0.0006 and this is where we draw a horizontal line. What we are looking for here is for the ATR to touch or dip below the 0.0006 line. Please note that you do not have to use the 0.0006 level in H1. Low volatility levels will vary in different time frames so simply have a look at the historical prices on your chart and identify where new trends have begun. The, simply align the touches of your line (at the desired level) with the beginnings of those trends. This will give you a comfortable level of low volatility. Watch the video if this still does not make sense.
Once we have identified a low volatility level and the ATR line is either touching it or has dipped below it, we need to reference the 8 and 21 simple moving averages (SMA). This is because ATR only tells us if the current trend is weakening; it does not tell us if a new one has begun. This is why we need the SMAs. If prices are above the 8 SMA and both the 8 and 21 SMA have crossed over, we have a good signal for an entry. However, before we trade we need a confirmation from H4 time frame where we need to see the same – prices above 8 SMA and both 8 and 21 SMA crossing over. If H4 also shows this, we have our confirmation and a good signal to enter a trade.

Low volatility reading in ATR couple with MA cross over/under signifies a good entry signal
Using Average true range (ATR) to set a stop loss
If currency pair A moves 100 pips per day and currency pair B 200 pips per day we can safely say that currency pair B is more volatile. Therefore, if we place a 10 pips stop loss in A, we cannot place a 10 pip stop loss in B because it is more volatile. If we did the stop loss would not be relative to B’s movement/volatility; it would be relative to A’s movement/volatility. This is where ATR comes in.
The most widely used formula is that the stop loss has to be placed at a price level that is 2 ATRs away from the entry price. To know which price level this is, we need to reference the current ATR reading; let’s say it is 0.0012. We then multiply the ‘12’ by 2 to get 24. We then place a stop loss 24 pips away from our entry price. By using the ATR in this manner it gives our trade room to move and results in us not being stopped out too early or too late.


